

Statistical modelling in digital marketing has increased dramatically in digital marketing over the last few decades. Thanks to advances in technology and the accessibility of big data, things have changed dramatically for businesses that never previously had that much data and consequently never were that eager to explore new ways to extract knowledge from their data.
In this article, we list some statistical frameworks that can be used for digital marketing. We don’t go into detail about the algorithm available for each framework due to the fact that choosing an algorithm is highly dependent on the problem you wish to solve.
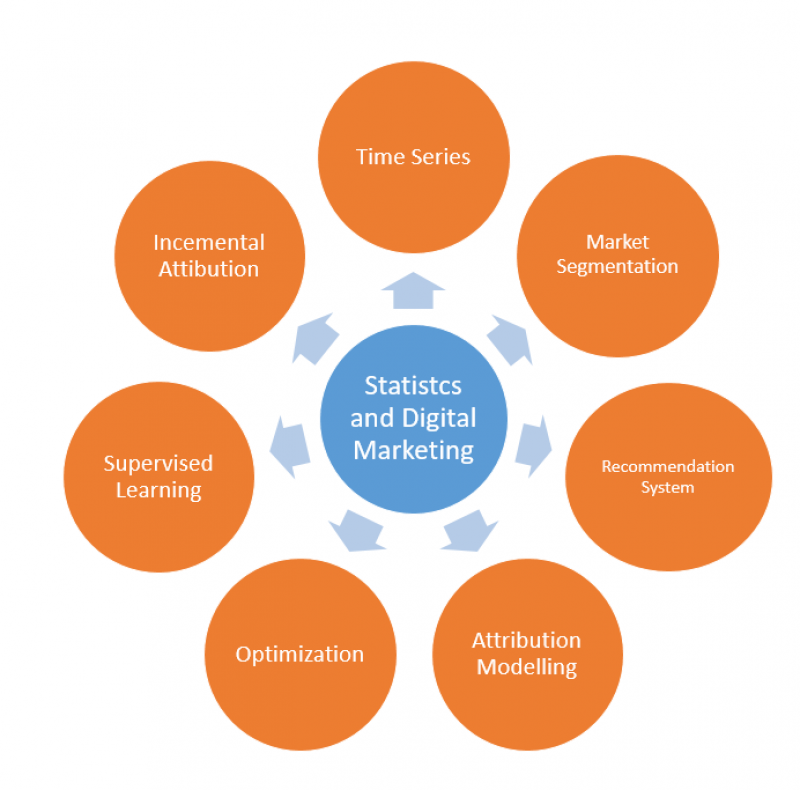
1. Time Series
Time series analysis comprises methods for analysing time-series data in order to extract meaningful statistics from it. This analysis can be divided into two categories: frequency-domain methods and time-domain methods.
In digital marketing, we mainly use the latter in order to predict the trend of different metrics in the future. Methods of time series analysis may be divided into parametric and nonparametric, linear and non-linear, and univariate and multivariate.
Time series are widely used to measure the impact of marketing activities by comparing the differences between the results that you actually observed as compared with what would have happened if the marketing event didn’t take place.
In other words, we are interested in the difference between the time series of the real world (after marketing intervention) and the time series predicted. As an example, we may use Inferring causal impact using Bayesian structural time-series models to estimate the impact of an event (such as a TV advertisement) on the traffic of your website.
Causal inference measures a causal connection based on the conditions of the occurrence of the effect which will apply to statistical modelling in digital marketing. This model tells us what would have happened to your traffic or other metrics in the absence of the advertisement.
2. Market Segmentation
In market segmentation, we divide customers into different profiles based on various factors such as consumers, businesses, priorities, demographic information, needs and so on. Based on this information, we can implement strategies to provide specific marketing plans for different profiles.
Clustering is a common approach for customer segmentation in which we group a set of objects in the same group which are more similar to each other than other clusters. Clustering is an unsupervised learning approach and unlike supervised learning, training sets are not required. In general, clustering combines variables related to each other and yielding the same information.
When the variables are clustered into groups, we can relabel them. After clustering and grouping the variables together, there is no global formula for interpreting the results.
Depending on the goals and structure of a business, decision-makers have different strategies. Some might relabel the group and some might choose the most important variable of each group as the main variable and disregard the others. For example, some people choose one variable (normally the most important one) from each group.
3. Recommendation System
Recommendation systems are often considered as a subclass of filtering systems that predict the preference of a user for an item. Two main types of recommendation systems are content-based and collaborative filtering methods. Content-based recommendation systems recommend a product that has similar attributes to what the user views or likes. For example, it recommends the movies that have similar characteristics to the movie watched by a customer.
Requiring human input to assign attributes to products is one of the disadvantages of this approach. Collaborative Filtering is a user-based approach which recommends that users who like the same product probably prefer a recommended product. For example, a supermarket might conclude that customers who buy beer also buy sausages. Cold start is a common known problem for this approach and often we don’t have many similar uses to start from for statistical modelling in digital marketing.
Association rule learning is a method to discover interesting relations between variables in large databases and is often used in Recommendation Systems.An association rule is an implication of expression of the form X results in Y and the strength of an association rule can be measured in terms of both values: Support and Confidence. Each of these is a great metric but can cause some confusion. Support is important because a rule that has low support may occur by chance. Confidence measures the reliability of the inference made by a rule. In other words, measuring Lift helps us to predict the users’ preference.
4. Attribution Modelling
Before you continue, Internetrix has put together an Advanced Guide to Marketing Attribution. It covers key topics such as; Types of attribution modelling, using Google Analytics and BigQuery, extracting data with BigQuery as well as covering offline attribution models.
In marketing, the key question is how to measure the effectiveness of your campaigns. But how can you get your attribution model to tell a story? As we explained here and here, most digital advertisers use the last-click attribution model to evaluate the success of campaigns.
In other words, during the customers’ journey and among different touchpoints or ads which impressed customers, only the very last event is considered as significant while the others are ignored. This is simple and easily implemented but, in most business cases it doesn’t help in making smart marketing decisions.
Survival analysis is a popular approach among biostatisticians to analyse the expected duration of time until one or more events happen, such as a death in biological organisms.
However, this statistical technique attracted scientists and technicians in other domains. Survival analysis is called reliability theory or reliability analysis in engineering, duration analysis in economics, and event history analysis in sociology.
In survival analysis, death or failure is considered an ‘event’; traditionally only a single event occurs for each subject, after which the organism or mechanism is dead or broken. Chandler-Pepelnjak (2010) proposed the use of survival analysis for marketing attribution analysis. He suggested that each event in a customer’s’ journey gives an indication of whether the journey is still alive. When the customer converts to purchase, the journey then ‘dies’. In recent years, in addition to survival analysis, concepts such as relative importance have drawn the attention of many researchers and marketers.
5. Incremental Attribution
Incremental Attribution analysis is based on identifying a Control Group or a baseline and comparing transactional and behavioural metrics with the rest. The aim is to identify a number of transactions and their revenue value which can be clearly and directly attributed to marketing activities
There are various modelling practices that can predict who will be persuadable customers. We believe uplift modelling is the most promising one. In uplift modelling, we build a model which predicts the causal influence of the action by comparing two datasets: The first dataset, called treatment dataset, applies when an action is taken. The second dataset, called control dataset, applies when no action is taken.
Currently, the most popular approach for predicting response rate is logistic regression. We believe it is theoretically flawed because we compare two models from two different universes: one in the treatment group and another in the control group.
This also means we are measuring the modelling errors twice. In our recent work, we used other nonparametric approaches that actually try to directly predict the uplift. Specifically, we used a decision-tree based approach which resulted in a very accurate learning algorithm.
With this approach, we can predict the difference that a marketer’s actions will make on the behaviour of customers, by comparing them to prediction of customer actions that would have happened without the marketing advertising. In this regard, marketers can determine if advertising for a particular customer is worth it or not.
Decision-tree based approaches provide clear customer segmentation and are very practical for modelling customers’ LifeTime Value to ensure that organisations are targeting the right audiences. These approaches both reduce campaign costs and increase marketing campaign ROI help with statistical modelling in digital marketing.
Additionally, we use Odds Ratio as a metric for the Customer Journey to show the transactional ratio of the presence of a channel over the absence of a channel. We can use this analysis method to measure the influence of a channel during the transactional decision. Odds Ratio provides information on the strength of the effect of presence or absence of one variable over another variable (channels and customer journey / positive transaction). It represents the odds that an outcome will occur given a particular exposure, compared to the odds of the outcome occurring in the absence of that exposure.
Another approach that can be used in Incremental attribution is Markov Chain which uses an attribution framework based on Markovian graph-based data mining techniques. Using this approach, we can measure the removal effect of a marketing channel from the customers’ journey to determine the channel contribution for a transaction.
6. Supervised Learning
Supervised predictive modelling leverages statistics to predict outcomes and is grouped into classification and regression. A classification problem is when the output is a category and a regression problem is when the output variable is real value. In supervised learning, each example is a pair consisting of an input object (typically a vector) and the desired output value (also called the supervisory signal).
Decision trees, logistic regression and neural networks are the common methods used for supervised prediction.
7. Optimisation
Most of the above-mentioned methods do not cover the complexities that we have in real life. Often, marketers have to include some additional constraints that are forced by the market or organisations’ strategies.
To address this, linear programming can be used to allocate budget to each marketing activity and at the same time cover all the constraints. The optimisation can be used in several domains such as Inventory Management, Optimum Bidding and Optimum Pricing.
We often use optimum bidding to detect and purchase the right keywords at the right price on Google Ads. Also, price optimisation models are often used to determine how high prices can be boosted before reaching strong resistance.
Conclusion
Although some people might disagree with this categorisation of the application of statistical modelling, we believe this approach provides a simple and clear understanding of statistical application for both practitioners and researchers.
In most digital marketing problems, other statistical approaches such as churn analysis, simulation, cross-selling, multivariate testing, scoring, Natural Language Processing, Indexation and so on, can be assigned into one of the above-mentioned categories.