The new Google Analytics 4 properties are an exciting new system that brings with it a new wave of next-generation reporting and analysis.
The upgraded platform is designed to provide actionable insights into app and website data, so that it is easier to explore data and insights at the level that is needed, from technical analysis to high-level reporting.
New & Improved Google Analytics 4 Properties
Google Analytics 4 properties provide a new approach to reporting is simplified, making it easier to access the information you want when you want it.
Google has swapped out the predefined reports in favour of reports that cover a single insight about a business like a summary card. Each summary card provides the option to access deeper insights for a more comprehensive outlook at the bottom of the card.
If the insights you are looking for are not available, the new Analysis feature will give you a greater range of data analysis options.
With a new drag-and-drop feature, dimensions and metrics can be easily added and removed to a report. Users can also quickly and easily filter, segment and sort data to focus on the insights that matter the most.
Universal Analytics Analysis & Reporting
Historically, Google Analytics would organise data into one of the dozens of pre-defined reports.
These predefined reports can be customised but if the information isn’t already available in any existing report, then it becomes quite difficult to find and or understand the insights that are required to meet organisational needs.
Reporting In GA 4
Summary Reports
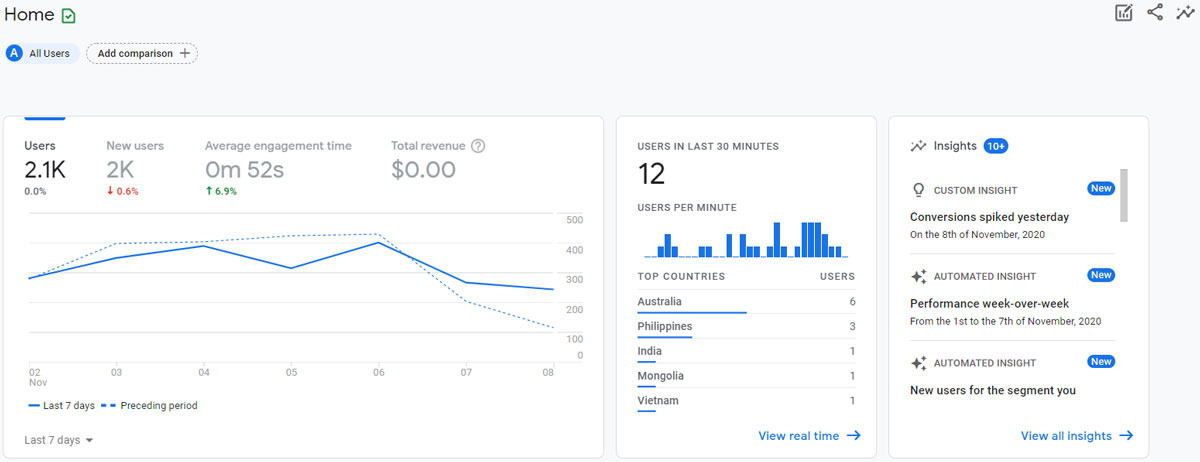
Summary reports show information about users, like how users are being acquired, active users, total users in a given timeframe etc. Each report shows a high-level snapshot of these insights using summary cards.
Real-Time Report
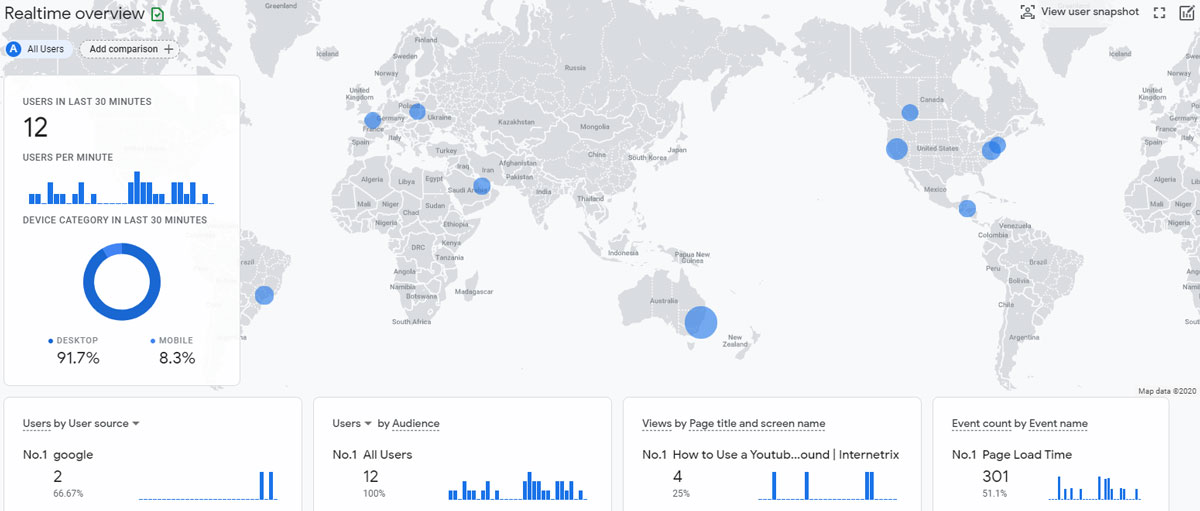
The Real-Time report reports on events that have taken place in the past five seconds and up to thirty minutes.
These metrics are important to analyse what an audience is currently doing and what interactions they are having with an app or website. This is useful in tracking which different segments are doing at the same time.
Analysis Techniques
Exploration
What insights can you uncover with custom charts and tables?
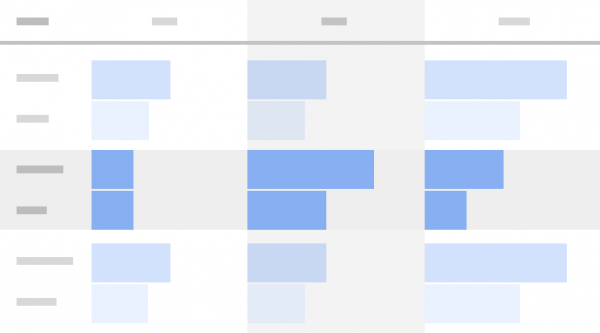
Exploration enables users to visualise data in a simple and flexible way. Users can drag and drop variables, create cross-tab layouts, arrange rows and columns as well as create different visualisation styles for reports.
Funnel Analysis
What user journeys can you analyse, segment and break down with multi-step funnels?
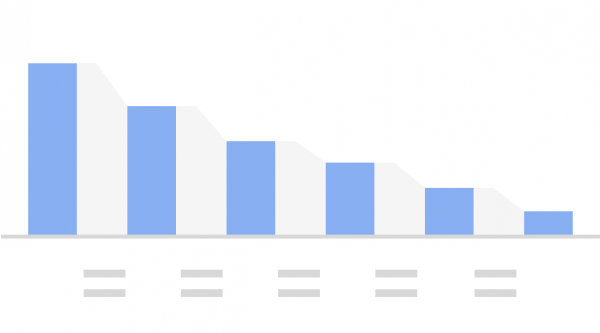
The Funnel Analysis is crucial in being able to visualise the steps users take towards a key task or conversion. Define up to ten steps a user can take in either an open or closed funnel.
Path Analysis
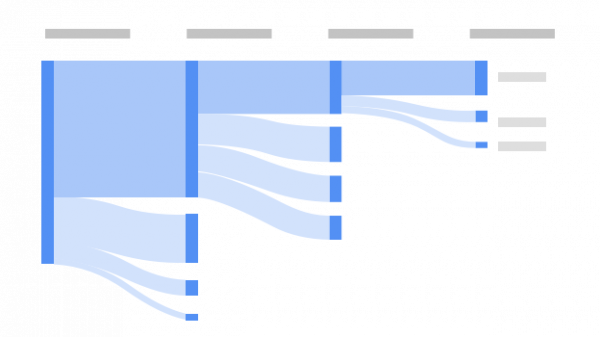
What user journeys can you uncover with tree graphs?
Understand how users transition from one stage in the customer journey to the next, with Path Analysis. Path Analysis, unlike Funnel Analysis, is free-flowing and can track any number of undefined paths – even paths users were taking that are unintended.
Segment Overlap
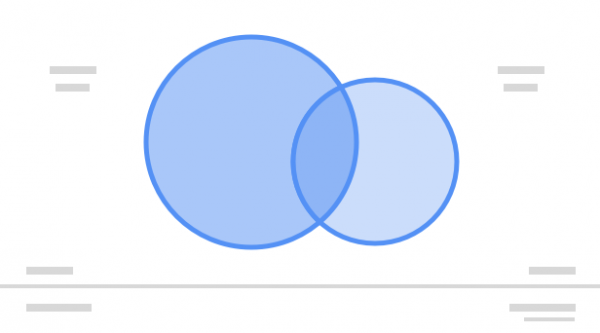
What do the intersections of your segments of users tell you about their behaviour?
Segment Overlap looks to compare up to three separate user groups in order to see if there are any overlaps and or similarities between segments. This can lead to the creation of new segments that were not previously identified.
User Explorer
What individual behaviours can you uncover by drilling into individual user activities?
User Explorer encourages the exploration of specific groups of users and learns more about them and their interactions. This is important when you want to personalise the user experience or when you need to gain insight into unexpected user behaviours.
Cohort Analysis
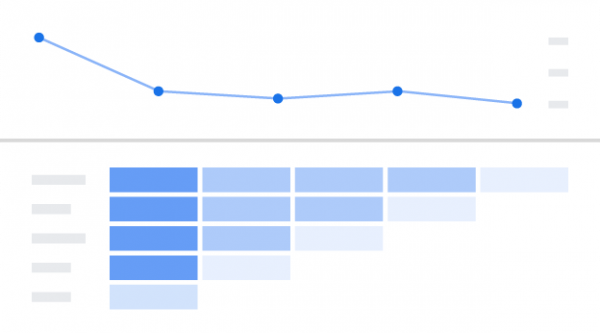
What insights can you get from your user cohorts’ behaviour over time?
A cohort is a group of users who share a common characteristic identified in this report by a specific event that the user has triggered.
To Wrap Things Up
We hope you have found this blog on Google Analytics 4 Properties helpful, and as always, if you need any assistance please get in touch to book a call with our Data and Analytics team
