

Companies advertising their products and services on television ask two burning questions: Firstly, do TV advertisements drive web traffic and sales? Secondly, if they do, how do they achieve this? How do we measure TV Attribution?
When I was a child, people gathered in the sitting room with all their attention fixed on the TV. The emergence of smartphones has radically changed things. Now, while viewers are watching TV they are also focused on a “second screen”, the nickname we give to their smartphones, tablet, laptop and so on.
Using their “second screen”, users can do things such as looking up information related to TV programs. A TV program or TV ad might attract a viewer’s attention which then triggers their use of the second screen to research the TV program. Organizations spend 40% of their media budget on TV advertising. When they spend that much budget of course they need to measure results to be able to optimise their advertising – tv advertising effectiveness.
TV advertising statistics
Many new studies have concluded that after seeing a commercial, TV viewers will use their second screen (their mobile device) to visit and browse online, then buy the advertised products. An estimated 84% of viewers who own smartphones use their mobile device as a second screen while watching TV.
Additionally, an estimated 27% of these viewers search for the product or check the advertiser’s website after watching a TV ad. Some empirical studies observed 80% of these visits happening within 90 seconds after watching the TV advertisement and about 90% of visits happened within 3 minutes.
Measuring TV advertising effectiveness with our TV attribution model
So, how can you measure the effect that TV advertising is having on web traffic and sales for your business with TV attribution? First we look at standard methods and their limitations, then we see how Internetrix addresses these limitations and goes a crucial step further with analytics to add value in measuring the success of your TV advertising.
Standard methods for measuring the effect of TV advertising
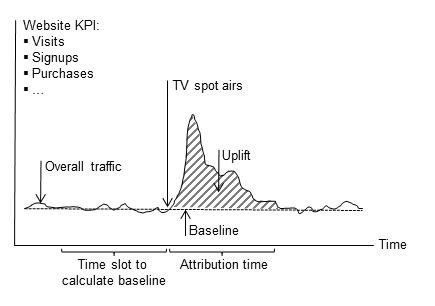
Many analytics tools offer a simple method applied through Google Analytics to measure the effect of TV advertising. These tools measure the traffic average for a period between 3 to 7 minutes to calculate the traffic baseline which we define as the web traffic that exists independently from traffic measured during the TV advertisement. This baseline is shown in the following graph as ‘time slot to calculate baseline’.
The term ‘overall traffic’ refers to the traffic that starts with a TV advertisement and finishes roughly three minutes afterwards. After the advertisement has aired, we take the overall web traffic and subtract it from the baseline traffic. The result of this subtraction tells us how much uplift there has been to web traffic when the TV ad aired, and we can then use this to measure the effect of the advertisement.
The summarised shortcomings of these standard methods are as follows:
- The longevity impact of the advertisement is not measured
- These methods do not consider the upward or downward trend of traffic before the TV advertisement. Instead, they simply compare the average of traffic a few minutes before and after the TV advertisement
- The methods focus on visitors and ignore possible changes in the number of subscribers, buyers, fans and so on.
How does our attribution method measure the effectiveness of tv advertising and fix the shortcomings of standard methods?
At Internetrix, we estimate the impact of an event (such as a TV advertisement) on the traffic of your website by using causal inference measured. Causal inference measures causal connection based on the conditions of the occurrence of the effect. We use the Bayesian structural time series, recommended and widely used by Google. This model tells us what would have happened to your traffic or other metrics in the absence of the advertisement. The great news is we can then estimate the effect of the advertisement.
Under the hood, we consider the web traffic as our response time series and we assume the pre-advertisment/intervention period as 24 hours. Based on a time series over the last 24 hours, we measure what would have happened in the subsequent minutes. We then compare our results with real results for the session starting after the TV advertisement.
An example to demonstrate the value of the XPON attribution approach
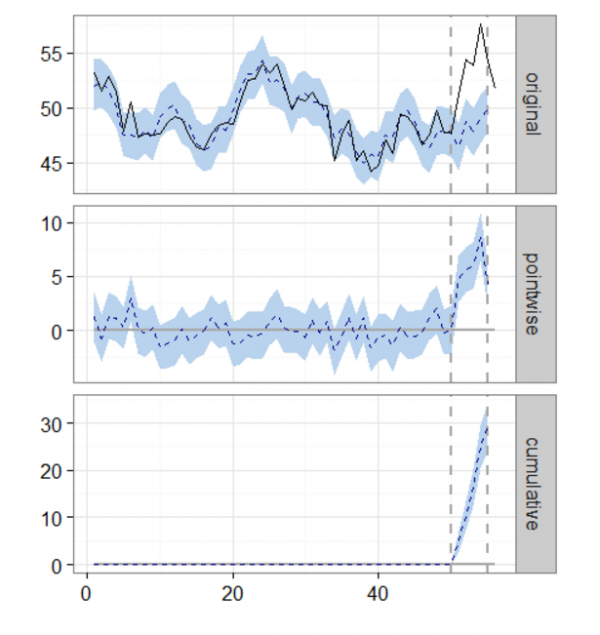
In the above graph, the vertical dashes show the duration of the TV advertisement. The blue dot points indicate the number of sessions predicted based on the session trend. The black line is what actually happened. Comparing the blue and black lines lets us see the effect of TV ads.
Technically speaking, we can see the response variable hitting an average value of approximately 54 during the post-advertisement/intervention period. This strongly contrasts with what we would have expected in the absence of an advertisement/intervention, where we would have predicted an average response of 48. Subtracting this prediction from the observed response yields an estimate of 6 for the causal effect the advertisement had on the response variable.
The above results are given in terms of absolute numbers. In relative terms, the response variable showed an increase of +12%. Technically we can also prove that the positive effect seen during the advertisement/intervention period is statistically significant and unlikely to be due to random fluctuations.
Conclusion
We know TV advertising can influence web traffic, however, in order to optimise its effect, we really need to measure it. At Internetrix we go beyond the limitations of standard attribution methods and sidestep their shortcomings by using our own attribution approach that is not only measuring tv advertising effectiveness and impact on the behaviour of visitors, subscribers, buyers, fans and so on, but also crucially measures this effect in different segmentations such as:
- Hour of day
- Network (TV channel)
- TV show
- Duration
- Market (National / Regional)
- Day of Week
- Cost
Based on these segmentations, Internetrix maximises success for its clients and adds compelling value to our analytics by not only measuring TV advertising results but also by giving recommendations when to consider scheduling advertisements for maximum effect. Are you looking to advertise on TV, or are you already advertising on TV and need help drawing the right conclusions for how much and where to spend?
To Wrap Things Up
We hope you have found this blog helpful, and as always, if you need any assistance please get in touch.