

Cohort analysis is another method that can be used to test the effectiveness of a marketing strategy for a particular target segment related to marketing costs and Customer Lifetime Value.
Despite this fact, there is a high chance that you have never used cohort analysis! For most marketers, cohort analysis is an obscure and unreachable approach.
A cohort is a group of users with the same behaviour. Cohort analysis shows how a segment of users perceive our website and how many actually find it interesting enough to be retained. So basically, cohort analysis looks at the different segment of customers over time and investigates how their behaviour is different.
Cohort Analysis in Google Analytics
There is a relatively new report in Google Analytics about cohort analysis with four ways to modify the report and two data visualisations.
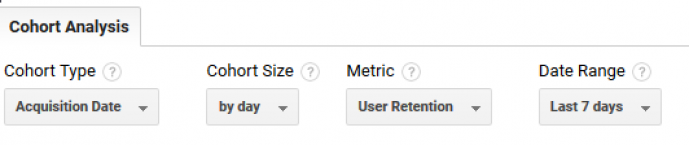
The four options for modifying the report includes:
Cohort Type: is now limited to “Acquisition Date”. It should be noted that Cohort analysis is still marked as Beta and we can hope that cohort type covers more groups in the future.
Cohort Size = day, week or month can be selected as the cohort size.
Metric = the default metric is “User Retention” and it can be changed to the following metrics:
- Goal Completion per User
- Pageviews per User
- Revenue per User
- Sessions Duration per User
- Sessions per User
- Transactions per User
- Total Goal Completions
- Total Pageviews
- Total Revenue
- Total Session Duration
- Toral Sessions
- Total Transactions
- Total Users
Date Range = It depends on your Cohort size. The maximum date range is 30 days, 12 weeks and 3 months, for the day, week and month, respectively.
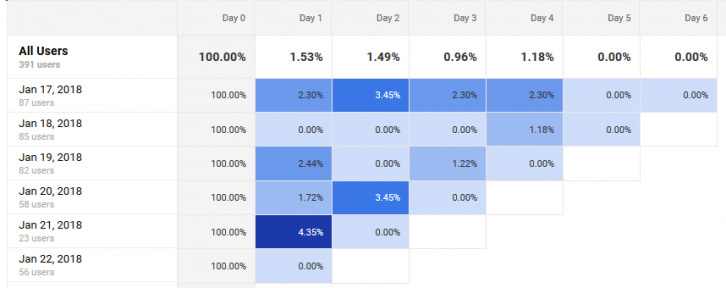
“Impact Plot” visualisation shows each cohort and their cohort metrics. For example, we can see the retention rate of the users on Jan 17, 2018, in day 1 was 2.30%
Customer Lifetime Value
Cohort analysis can be used in several types of analyses and is especially useful when analysing the engagement of customers. In this article, we only focus on calculating Lifetime Value (LTV) based on cohort analysis.
There are some simple steps that need to be taken for measuring Customer Lifetime Value using cohort analysis in Google Analytics.
- Choose the right settings: depending on your marketing goals you should select a Cohort Type, Cohort Size and Date Range. This depends on what view or deduction you are trying to obtain from the Lifetime Value report. “User retention” metric is the default value that is required for calculating LTV. The following formula should be used for calculating LTV:
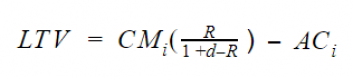
It’s a simple operation where:
- CM = customers’ margin
- R = retention rate of customers
- d = discount rate
- AC = customer acquisition cost
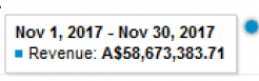
2. Measure the customers’ margin in the selected cohort: For example, looking at the revenue from the cohort group, we are interested in the cohort of customers who are acquired in date range between Nov 1, 2017, and Nov 30, 2017.

In order to measure customers’ margin, we need to calculate CM components of the above formula; which is the differences of Revenue and cost associated with the customers in our cohort as presented in the following formula:
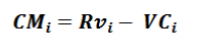
Where
RV = Customer revenue
VC = Customer variable cost
Variable costs are the costs of customer demand. Customer demand can also be represented by the costs of all goods sold. We can easily obtain this information in our database or in Google Analytics. For example revenue in this period can be seen in E-commerce report in GA:
3. Measure the retention rate of customers: this number is easily available in our cohort result. For example, if we are interested in measuring LTV for one month, the LTV is retention rate after one month in the impact plot:

4. Measuring discount rate: Discount rate converts future revenue into today’s money. There are tons of formulas available for calculating a discount rate. However, often marketers estimate a discount rate based on their experiences. A discount rate of 10% is commonly used in many firms.
5. Measure customer acquisition cost: Acquisition Cost (AC) is the value of the investment required to generate a sale. It often can include other start-up costs such as your advertisement and campaign spending which can be accessed in your database and in Google Analytics.
So what have we covered?
To sum this article up, we aimed to change the perception of Customer Lifetime Value as being an obscure and unreachable approach. The beauty of the new features introduced on Google Analytics, namely Customer Lifetime Value and Cohort Analysis, have allowed for a simpler way to calculate Customer Lifetime Value.
We’ve provided a step-by-step guideline for using Cohort Analysis in Google Analytics to calculate LTV but we know sometimes implementing these calculations can still be confusing.